Command Line Tool to Inspect Parquet, CSV, and other DataFrames 🐂 🌾

When it comes to data, most data scientists know how to use pandas for exploratory data analysis. Spin up a python environment or Jupyter notebook and start loading your data. These couple of extra steps can be a time suck if you only want to poke around your data.
Enter Oxen 🐂.

Oxen at it's core is a blazing fast dataset versioning and management tool. With oxen you can add, commit, and push large sets of images, video, audio or text, like you do with your code. Checkout the Github here: https://github.com/Oxen-AI/oxen-release#-oxen.
Internal to Oxen is a DataFrame library called Polars https://www.pola.rs/. Polars helps Oxen enable data science workflows. When it comes to version control, oxen uses it compute useful diffs between datasets.

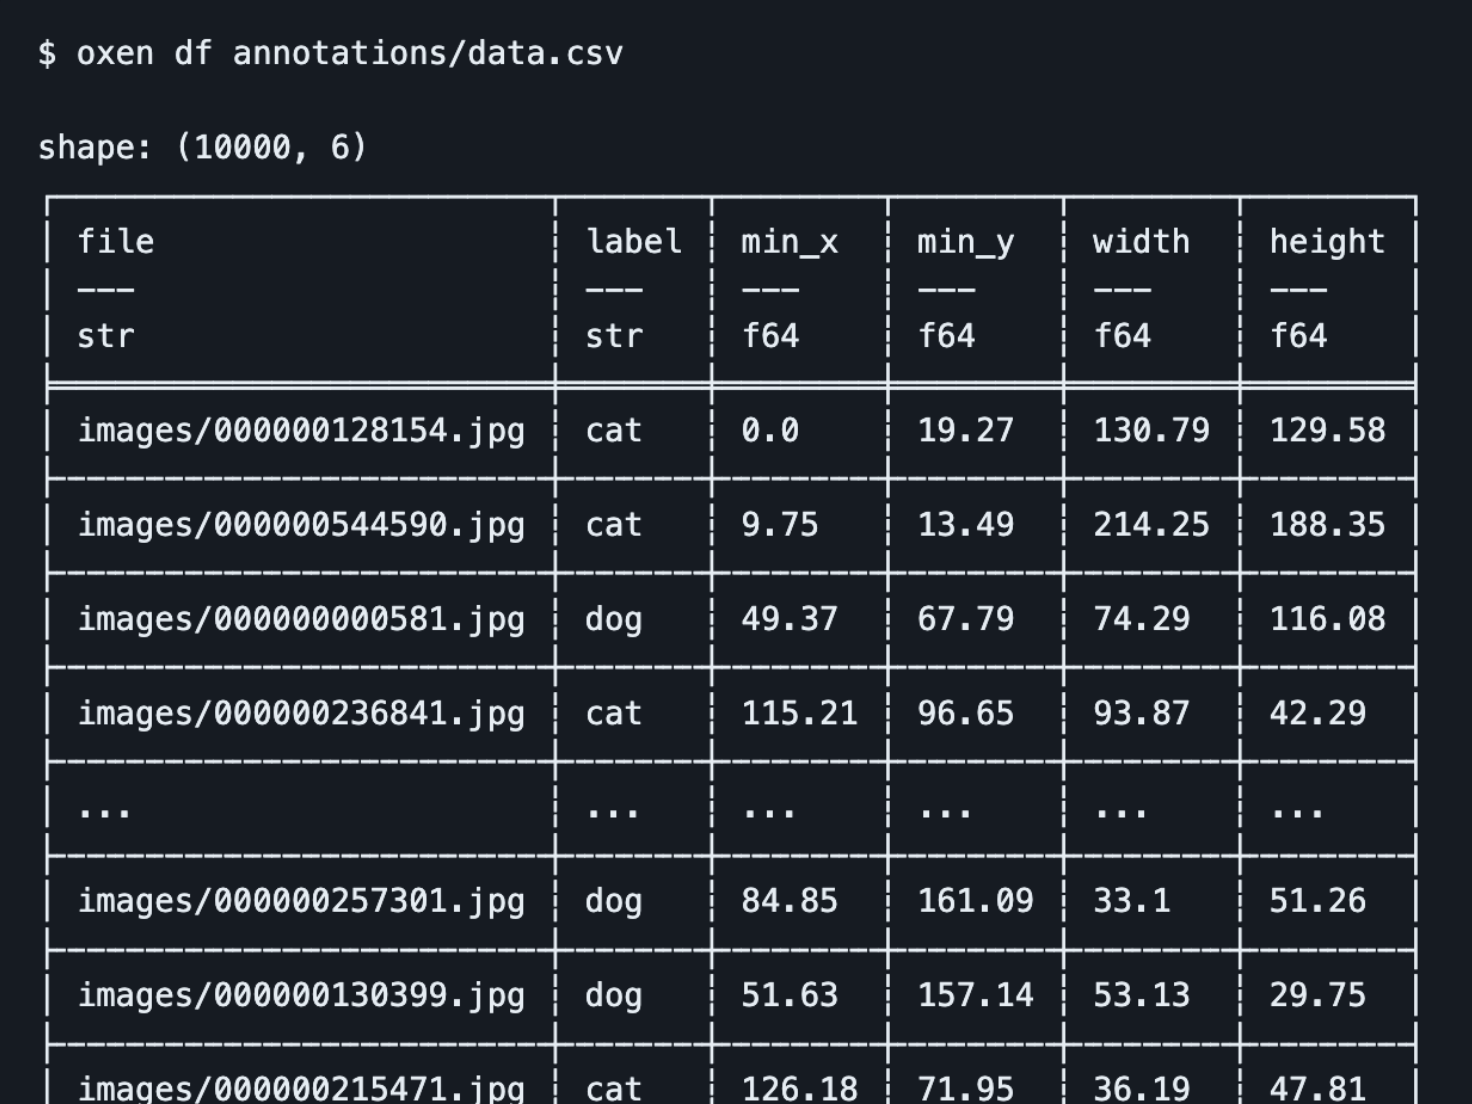
Oxen+Polars allows you to summarize DataFrames on the command line with zero dependencies.
$ oxen df annotations/data.csv

Oxen also has handy command line arguments for slicing, dicing, and reformatting data. For example you can grab the first 9000 rows and convert to a parquet file in a single command.
oxen df annotations/data.csv --slice '0..9000' -o annotations/data.parquet

Oxen supports converting between common formats such as "csv", "tsv", "json", "jsonl", "parquet", and "arrow" by adding the -o flag.
Oxen lets you filter your data given some basic boolean operations.
oxen df annotations/data.csv --filter 'label == dog && height >= 200'

If your table has many columns, narrow them down to a subset of columns with - columns flag.
oxen df annotations/data.csv --columns 'file,label'

Oxen allows you to explore data with powerful aggregation functions such as "count", "min", "max", "mean", "std", "n_unique", etc.
oxen df annotations/train.csv -a "('label') -> (count('file'), n_unique('file'))"

This is a peek at the functionality of what you can do with Oxen. Feel free to check out the rest of the functionality on Github. Give us a star, for every star, an Ox gets it's wings.


